Dunshire Doom Perf: Part 2
This is part 2 of what I’ve learned while improving the rendering performance of Dunshire Doom. Part 1 was all about drawing the map using a single drawcall (instead of thousands). Part 2 will be looking at how to render thousands of monsters (sprites) quickly. By the way, all these improvements are available in the current build (v0.9.0).
Prototype
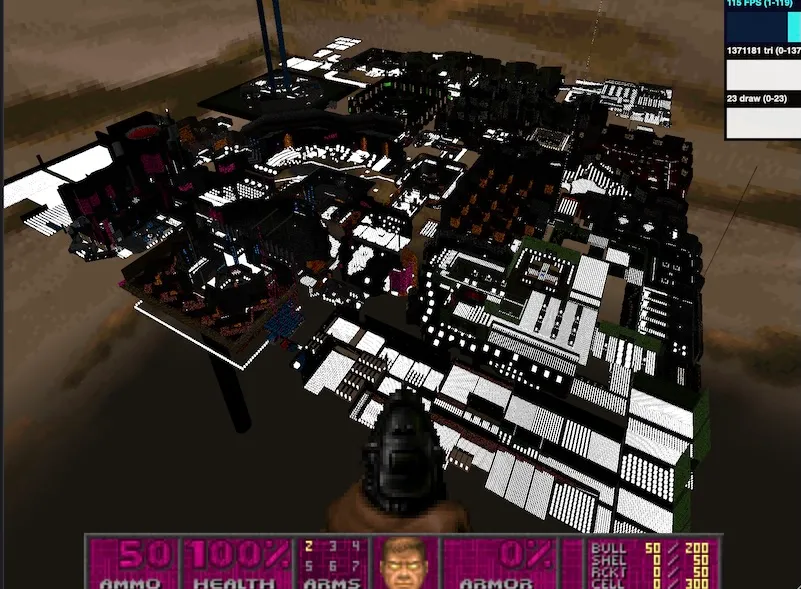
Similar to map rendering, I started looking at sprites with some prototype code. Now that I understood vertex buffer objects and had a rough idea how instance geometry works, it didn’t take long to come up with something that rendered all 74,000 monsters from Cosmogenesis MAP05 as white boxes:

I also prototyped threlte’s instanced sprites but found it didn’t quite fit what I wanted:
- DOOM sprites are not a fixed size. Even sprites from the same monster have different sizes depending on the frame of animation.
- Sprite rotations. DOOM sprites change based on the angle of the observer and, as far as I could tell, it wasn’t supported.
- I want billboarding only on the z-axis (cylindrical billboarding) and I wasn’t sure how to achieve that.
- Performance. Because Threlte was relying on svelte components, it always just felt a little slower than a prototype without it.
The prototype was a success. I ruled out one path and had a pretty clear idea of what needed to be done.
Custom Shader
For the most part, the shader work was straightforward. At a high level, I created a texture that contains all sprites and an index that tells me the coordinates of those sprites. Each geometry has an attribute that says what sprite index to use and from that, I can look up the coordinates and choose the right sprite.
There were a few tricky bits though and as I learned more about shaders, I was able go back and make improvements to the map shader too.
Sprite Size
The texture atlas contains the size of each sprite but I wasn’t sure how to use that informaiton to scale the geometry. I wanted to do as much work as possible on the GPU to free up the CPU.
Now, if you have a basic understanding of vertex and fragment shaders, you’ll realize that changing the geometry is as simple as changing the output of the vertex fragment. I didn’t know this at the time (face palm) but eventually I figured it out. So in the vertex shader, I could fetch the sprite coordinates, turn it into size, and apply it to the vertex to scale the geometry based on the sprite size:
...
sUV = texture2D( tSpriteUVs, tUV );
vDim = vec2( sUV.z - sUV.x, sUV.w - sUV.y );

// scale the vertex position (transformed) based on the
// dimensions of the sprite
vec2 dim = vDim * tSpritesWidth;
transformed *= vec3(dim.x, dim.y, dim.y);
The real compution is a little more complicated than what’s above. DOOM saved memory by mirroring sprites so if a sprite is mirrored, we need to scale dim.x by -1. Also we don’t need to scale the y-axis by dim.y but we do it for the overhead camera.
After figuring out the sprite vertex, I realized I could be even more efficient in the DOOM map fragment shader. Back when I wrote it, I put most calculations into the fragment shader which is inefficient. The sector light level and texture coordinates and dimensions do not change per pixel so we are better off computing them per vertex. I wish there was a way to measure shader performance in WebGL to see what kind of difference these changes had.
A takeaway for me from this work is: (in general) do as much work as possible in the vertex shader. The vertex shader is, in general, run 3 times per triangle while the fragment shader will be run per pixel on screen.
Sprite Rotations
A cool effect from DOOM is that depending on the way a monster is facing and the angle of the observer, DOOM will choose one of 8 different sprite rotations:
The original Dunshire Doom code computed which rotation sprite to use with atan2() (where $mpos is the monster position, $camPos is the camera position, and $mDir is the way the monster is facing):
$: Math.atan2($mpos.y - $camPos.y, $mpos.x - $camPos.x);
$: rot =  Math.floor((EIGHTH_PI + normalizeAngle(ang - $mDir)) / QUARTER_PI) % 8;
$: frame = frames[rot]
This code would never scale because everytime the player moved, ALL monsters in the map would recompute which sprite to show. Updating this calculation 60 times per second for 74,000 monsters is very expensive. Modern JS engines are amazing and the code worked so I just kind of left it alone.
Now that I’m revisiting it and moving it to the shader, I wanted to be more efficient. I’ve heard that inverse trig functions are expensive so I wanted to find a way to avoid that. That led me to playing around a little with dot products and eventually finding a way to compute rotation without atan2().
Recall that the dot product of two normalized vectors is the cosine of the angle between those two vectors. This means I can determine if I am in front of or behind a sprite based on whether the dot product is positive or negative. Similarly, I can take the dot product of a normal vector and figure out if I am to the left or right. The last insight was to not compare offset the comparisons by 1/8 * PI.
Playing with diagram below should illustrate how the parameters in the code work:
Drag the green ball around the center point and see the value of the two dot products update as well as the computed angle. h2 is 1 when the dot is in the “second half” of the rotation.
After playing around a little, I could compute the rotation with only dot product and step functions. There may be a way to make this faster with vec3 instead of adding step() results but without profiling, I’ll leave it as is.
const float split1 = 0.9238795325112867; // cos(PI/8);
const float split2 = 0.38268343236508984; // cos(PI/8 * 3);

vec2 cdir = normalize( mpos.xy - camPos.xy );
vec2 vdir = vec2( cos(direction), sin(direction) );

// dot and dot of a normal to figure out quadrant
float dot1 = dot( cdir, vdir );
float dot2 = dot( cdir, vec2(-vdir.y, vdir.x) );

float h2 = step(split2 - dot2, 0.0) + step(split1 - dot1, 0.0);
float rot =
    (1.0 - h2) * (
        step(-dot1 - split1, 0.0)
        + step(-dot1 - split2, 0.0)
        + step(-dot1 + split2, 0.0))
    + h2 * (4.0
        + step(dot1 - split1, 0.0)
        + step(dot1 - split2, 0.0)
        + step(dot1 + split2, 0.0));
return rot;
Bonus: Sprite Wiggle
While building the original renderer, I noticed the burning barrels in Doom 2’s MAP23 wiggle. There are torches that show a similar behaviour but it’s less noticeable than the barrels. While the code tries to compensate it only worked when you look directly at the object. If the object moved towards the side of the screen you could still see a wiggle. This was also, yet another, calculation that was performed in JS each time the camera changed position.
As part of sprite billboarding, we can now apply the offsets before rotating the sprite for billboarding which means we no longer see the wiggle. A nice little bonus - in addition to not performing this computation on the CPU.
Stores and Events
Even thought the shader was working, performance wasn’t quite where I wanted it. I would load up Cosmogenesis and see 17-25fps and lots of GC stutters. The framerate bothered me because my prototype could run at 120fps. Here is the profiler output:
![]()
Notifying subscribers of sprite changes takes 35% of the CPU time. One thing I had a hard time reading in the profiler data was GC pauses. The framerate fluctuated quick a bit from 15fps up to 25fps for a few seconds and back down again. Something in that notification was causing GC load.
As a quick experiment, I disabled the subscription and ran a thread to randomly update 50% of the monster sprites 10x per second and performance was back in the 120fps range. Armed with that knowledge, I took an event emitter off the npm shelf and won back some performance. I was sitting around 50fps but still noticing GC spikes. A quick look at the source shows why. On each notification, the code creates a new list and throws it away. That’s going to be thousands of wasted lists each second in this case. As the event emitter is pretty simple, I wrote a small one that uses objects and arrays and avoid iterators for even more speed.
Now with a hand-rolled event emitter, we are only using 19% of CPU time, getting 60-70fps, and seeing fewer GC pauses (thought it’s hard to quantify):
![]()
There is still work to do in the game code and there may be opportunities to simplify sprite updates further but I’ll leave that as future work.
Other Improvements
-
Compute scrolling wall texture offsets in the shader instead of in JS. This saves 3% of CPU time for large maps and we can interpolate for smoother scrolling at high framerates.
-
Sprite interpolation in shader. Instead of recomputing the sprite position for each frame in JS, we now compute on the shader. In the old renderer, sprite movement interpolation used 8% of CPU time.
-
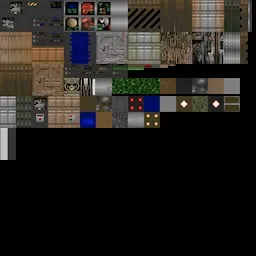
Smaller sprite atlas sizes. Instead of hard-coding the atlas to max texture size (which is 8K on my machine) we choose a size that can fit the content. So instead of an 64 mega pixel texture rudely using 256MB of video memory like this:

We get an 1 mega pixel texture politely using 4MB of memory:

Results
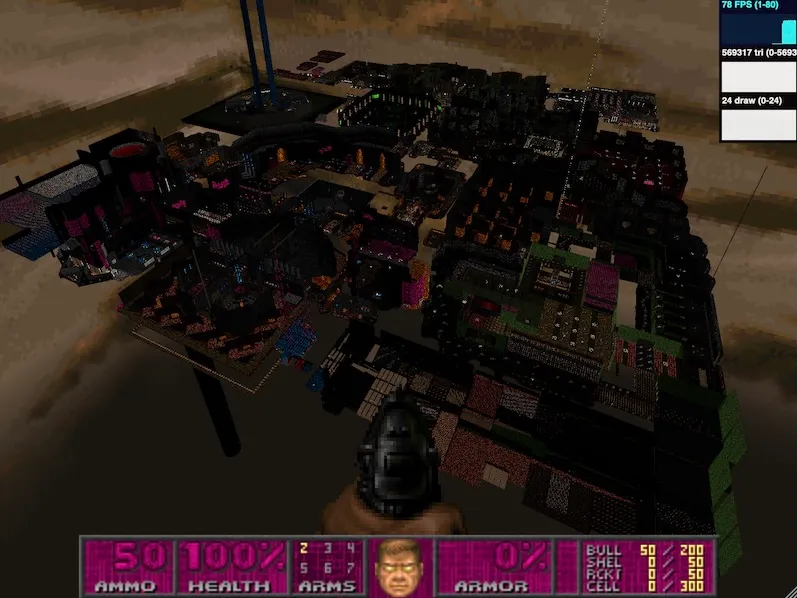
Remember the 74,000 white boxes? It’s now 74,000 monsters:

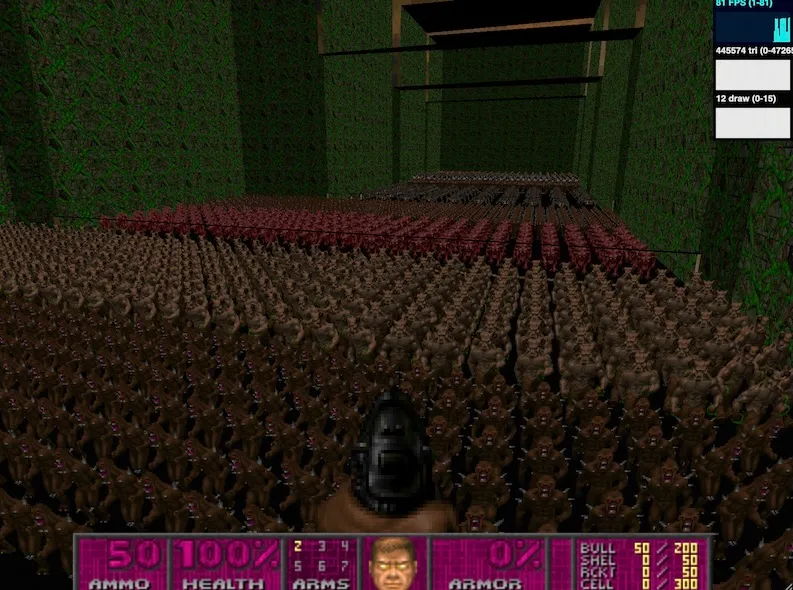
For fun, here’s a closeup of one monster closet from Cosmogensis:

A fly over nuts.wad with 7,700 enemies in the first room (monster AI is disabled because future work):
Future Work
In it’s current state, Dunshire DOOM can load large maps like Cosmogensis or Profane Promiseland but the maps are not playable. For part 3 of this series, I’m going to:
- Profile code and see what can be done to improve perf. We are probably not going to get the perf of DSDA-DOOM or Helion but if we can get the map playable, that will be an achievement.
- Optimize visibility/movement checks for monsters. I know these checks are slow. One idea is to go back to the blockmap. For large maps, we need to traverse upwards of 200 nodes which is much more expensive than a spatial hashmap like the blockmap.
- Fewer colour channels on textures. We apply DOOM’s colour palette when creating the textures but if we apply the palette in the shader, we can get even smaller texture and therefore less memory usage (and do things like palette swaps)
- Examine and reduce memory usage where possible. For example, the game code uses lots of svelte stores which are really cool but not necessary here.